Great Looking Mobile Campaign – But Did it Work?

2011年7月26日 星期二 by :::陽光馬戲團:::


Eric Rickson

Eric Rickson June 17, 2011 1,552 Views 2 Comments

Director Mobile Analytics

View Posts Close

Over the last two days, at the Mobile Marketing Association Forum, I have seen some really cool case studies about the innovative and creative mobile campaigns agencies have launched for some of the biggest brands in the world. What was clearly missing was the focus on the programs’ effectiveness or performance against stated marketing objectives. When members of the audience asked, “were they good?” The agencies didn’t quite know how to respond.

It was a little awkward, but set the stage perfectly for my colleague Mike Ricci as he took the stage to speak to the how analytics informs strategy by understanding consumer behavior, shows the return they are getting from their mobile investments and ultimately informs optimization activities.

Mike opened the session by laying out the problems and solution:

  • 63% of mobile marketers aren’t measuring or don’t know how their programs are performing (according to eMarketer)
  • As brands strive to evolve from mass communication to 1:1 dialogue with their customers and social media puts control of this conversation in the consumers hands, the need to understand how their customer interacts with their brand across many touch points is imperative
  • Brands need to understand how they engage with each medium as part of my marketing mix, but mobile and other digital data continues to be isolated in silos
  • What is needed is an eCRM approach that unites data from across the digital ecosystem to help crush these silos and achieve consumer centric view

Next the conversation progressed to guidance in how to approaching mobile measurement:

  • How are you measuring mobile? 7 out of 10 brands are just measuring number of downloads as success metric
  • We see a maturity to model that many brands are following in terms of what they are measuring and how they are using the data
  • Now some marketing leaders are demanding proof of effectiveness and ROI before spending another dime in mobile. Must measure more than download to provide this evidence of a good investment
  • The most sophisticated mobile marketers are using this insight to drive incremental investment.

Finally, he closed with some advice on how to approach within an organization:

  • Start early- consider measurement as part of the planning phase
  • Involve Key stakeholders- get the organization to define success
  • Measure all mobile engagement, don’t just stop with SmartPhones
  • Focus on critical measures, don’t get buried in mountains of detail

Analytics should be informing strategy. Used properly it should re-shape the way you engage with your customers.

Filed under having 0 意見  

證明社群媒體投資報酬率的十大案例

2011年7月19日 星期二 by :::陽光馬戲團:::

The question of whether or not social media drives ROI still plagues many marketers and brands. The issue is not always as straightforward as it seems, as there are multiple ways to measure the benefits of social media and it isn’t as simple as looking for a direct sales return at one end, with the social media imput at the other. Smart tracking and measuring is needed to fully capture the benefit of a social media campaign and while looking for direct ROI is one way to do it, there are other values to be measure from social media marketing. I’ve put together a list of case studies that prove the ROI of social media, both through direct monetary return, customer loyalty, repeat traffic and more. Viewing social media holistically to gain a better understanding of how it can work for you is more beneficial to any brand than looking for one single return. Remember that social media marketing is not the same as online advertising ; it’s not necessarily something that can be switched on and off to directly produce revenue.

Social media outperforms banner ads

An excellent way of ascertaining the value of social media is to look at how it performs compared to more established channels or advertising methods, such as banner ads. While you can’t compare this like-for-like on a purely cost basis, you can look at how both are actually performing for you in terms of the quality of traffic they drive to your site. In this case study from Ignite Social Media, they take one of their (unnamed) clients and compare a banner ad campaign firstly to a social competition, then a social game involving a sweepstake. In both cases the banner ad and social mechanic were driving traffic to the same website. In the case of the social contest, traffic driven to the site by the social game was 6.5x more effective in terms of cost per visitor than banner ads and drove 5.67x more visitors. More detailed findings can be accessed on the site. Importantly with this case study, the quality of traffic from the social media campaigns was found to be more effective than banner ads. So while it might seem like a good solution to buy in traffic via ads, it’s not necessarily going to provide long-lasting value for your brand.

Social media saved Cisco $100,000

Providing an alternative way of viewing the ROI from social media, this case study from Cisco shows how social technologies saved them over $100,000 on a product launch. Instead of looking at their traditional method for launching a product, which would have been a costly activity, they looked to social media instead, to do things in a slightly different way. While normally their product launches would involve flying in high profile execs alongside methods such as costly newspaper ads, for their new router they ran a launch that took place entirely online. They even turned to Second Life, staging a pre-launch concert in there. And while their online launch saved them money, it also allowed them to reach a wider audience, further extending the value of the campaign. In total, the online launch cost a sixth of their traditional product launches and produced better results. A great example to show how social media can be used to change the way a business typically operates, driving ROI where you might not expect it.

Old Spice put their money where their mouth is

To really see the value of a social media campaign and how it can drive ROI, it’s worthwhile taking a look at one of the most famous and successful social media campaigns so far : Old Spice. Through their campaign, which included sending personalised video messages to social media fans and celebrities, they’ve managed to gather some pretty impressive stats that show the money where the buzz is. The reach of the Old Spice campaign is not in doubt, but did it actually impact sales? According to the marketing agency behind the campaign, it did. Since the original campaign launched with ‘Mustafa’, sales increased by 27% year on year. But in the 3 months after the height of the campaign, sales were up by 55%, reaching 107% in the final month of the social media campaign. And of course, Old Spice is now the number 1 body wash brand for men. However you choose to look at the campaign, these figures stand up to show that a social media campaign, well executed, can drive significant ROI for your business.

Restaurant chooses closed social network

To show that social media can also drive ROI for small businesses, this restaurant is showing that social technologies can be used in different ways to drive customers. Houlihan’s is a restaurant chain in the U.S. which has around 100 restaurants, compared to their main competitor Applebees, which has over 2,000. With a small marketing budget but a lot of common sense, their marketing manager managed to drive sales directly from a private social network, run via Ning. The network was called ‘HQ’ and was launched in early 2008. By combining their social media campaign with email marketing, they managed to quickly build up 10,000 members of the network, allowing them to send exclusive discounts and promotions to customers. In one campaign that they ran for a Sex and the City promotion, they tracked, the restaurant estimated that “7,000 to 13,000 people heard about our newest promotion BECAUSE of an HQ member”. This shows the strength in running your own social network and how sometimes a private network may be the way to go, to offer people exclusivity and also encourage word of mouth.

Social media keeps the creme Brulee Man travelling

If you’re looking for a good example of social media ROI, then the Creme Brulee Man is a good place to look! The Creme Brulee Man is a food truck in the U.S. that keeps people up to date about its next location via Twitter. In this case, social media is actually keeping the business going, as it allows the owner to reach a new audience and alert people as to where he’s going to roll up next. This is a pretty good example of proving the value of social media, showing that it can actually support an entire business. In just over a year the truck’s Twitter account has gathered over 12,000 followers, which is an impressive number for such a small business with a relatively small geographic target.

Social media customers are more valuable

As well as looking at the direct revenue driven from social media channels, smart companies will be looking at the longer term impact of social media activity and just how valuable these customers are after the initial sale or contact point. A case study from CareOne is useful here. They introduced a new social customer care team, to use social technologies to reach out to current and prospective consumers. What they found was that customers that had come through one of these social touchpoints, filled out the customer consultation form at a higher rate than other customers, at 179%. They also completed their first payment through the company, at a higher rate of 732%. What this shows is that using social technologies can help you to qualify leads, but also drive more engaged traffic. The outcome of a personal contact through social media is that the customer will ultimately trust you more and will also be more invested in the company by the time they come to complete the sale, leading to an increased likelihood they will convert.

ROI from Facebook ads

Proving that ROI from paid social media activity also performs well, this case study looks specifically at the value driven from Facebook Ads. Vamplets is a small business that makes baby vampire dolls and they introduced Facebook ads as a new channel for driving revenue. Despite a fairly small Facebook ad budget of $250 per month, they’re generating an additional $1,000 in revenue, directly tracked to the ads themselves. This gives them a positive ROI of 300% and shows how cost-effective Facebook ads can be, particularly when you’re going out to a more unique or targeted audience.

Subway Slim Down Challenge

In another good example comparing social media to traditional forms of marketing, the Subway Slim Down Challenge has some impressive ROI figures. The case study released by Say It Social, shows how they used social technologies to raise awareness of the Slim Down Challenge and recruit speakers. The strategy included a social competition launched via the customised Facebook Page. This was part of a full marketing strategy for the campaign, but despite being active across a range of channels, they found that 71% of site traffic that went to the registration page, came directly from Facebook. This is an impressive case study in showing how social activity can stand up and outperform even established marketing channels such as TV and Newspaper ads, and marketing via websites within the network.

Reviews drive sales

it’s been widely discussed that opening up your products to reviews and even inviting negative reviews don’t necessarily impact negatively on your brand. By displaying both the good and the bad reviews you can help qualify out people that may not be suitable for your product but you also show that yours is a brand that can be trusted, as any issues people do have are clearly displayed, demystifying the purchasing process for brand new customers. An interesting case study from Cars.com shows that pages that had ratings and reviews introduced onto them had a 16% higher rate of conversion, and a 100% higher rate of traffic through to dealer’s sites. This shows the positive impact that social technologies can have when introduced onto your own site, to improve the purchase cycle.

Reducing customer service costs

Our final case study might be viewed somewhat negatively by some, as it looks at ROI from social media being directly driven by saving on staff costs. As more brands open up through social media however, they find the communities they nurture often begin to answer each other’s queries with regards to product questions etc.. In the case of InfusionSoft, they used social technologies to better inform their customers and keep them up to date. Whereas they previously would have had one customer service agent to 72 customers, through social media they were able to reduce this to 1 agent per 172 customers. Along with this the satisfaction rating also increased by 10%, which would no doubt lead to more repeat business for the company and more customer referrals. Though this might be a slightly alternative way of viewing ROI, it shows that social technologies can make real business savings, allowing money to be invested elsewhere, or in developing these technologies themselves.

社群媒體的具體投資報酬率雖然難以直接衡量,以下由知名科技部落格The Next Web所收集的10個例子,卻能充分說明社群媒體的好處:

1. 社群媒體超越橫幅廣告
Ignite Social Media研究機構所進行了一份調查,將一位客戶的橫幅廣告和社群競賽活動作比較(兩者連結到同一個網站),結果發現以每位訪客所耗費成本的觀點來看,由社群活動所導引的流量比橫幅廣告有效6.5倍,而且帶來了5.76倍更多的訪客。

2. 社群媒體替Cisco省下了$10萬美金
傳統來說,Cisco在推出新產品時會動用到像是報紙廣告等昂貴的方式,不過在一款新型路由器上市時,他們改用完全線上宣傳,甚至還在知名線上遊戲Second Life第二人生上,舉辦了一場上市前演唱會,結果成本不但是傳統行銷的六分之一,接觸到的群眾也更廣。

3. Old Spice帆船紅色警戒香水沐浴乳把錢花在口碑上
這個社群案例至今仍是史上最熱的病毒行銷之一,借助針對粉絲及名人打造的個人化影片訊息,3天內就超過了2000萬的YouTube點閱率,最後銷售也增加了107%,Old Spice更變成了男性身體沐浴乳的領導品牌。

4. 餐廳選擇封閉式社群網絡
美式連鎖餐廳Houlihan’s運用Ning平台的服務,在2008年初打造了一個私人社群網絡HQ,並借助社群和email行銷,讓會員人數快速累積到了1萬人,以提供獨家的折扣和促銷給客戶。Houlihan’s也曾進行一個慾望城市宣傳活動,結果估計有7000到13000名用戶,都是因為HQ會員而得知這個消息。

5. 社群媒體讓焦糖布丁攤販老闆生意源源不絕
如果你是沿街叫賣的食物小販,該如何讓客人知道你今天會在哪?美國的一家焦糖布丁攤販老闆,就聰明地利用Twitter宣布他每天的工作地點,一年間創造了超過1萬2千名跟隨者,此外他還在Twitter上告訴人,他會在哪一天賣什麼口味的焦糖布丁,並詢問客人意見,因此成功地和他的跟隨者們建立了良好的個人關係。

6. 社群媒體客戶更珍貴
看護公司CareOne導入了一個全新的社群客戶照護團隊,運用社群技術來接觸現有及潛在的客戶,結果發現經由任何一個社群接觸點而獲得的客戶,填寫顧客諮詢單的比例,是傳統客戶的179%,完成第一筆付款的比例更是732%,顯示社群媒體所提供的個人接觸,能增加客戶的信賴度,它們因此可能願意投資更多。

7. Facebook廣告的投資報酬率
Vamplets是一家製造吸血鬼娃娃的小型企業,他們引進了Facebook廣告這個引導營收的新管道,雖然每月的預算只有$250美金,卻帶來了額外的$1000美金收益,也就是300%的投資報酬率。

8. Subway的減肥比賽
Subway在Facebook的客製化頁面上推出了一個減肥比賽,並經由電視及報紙廣告等各式各樣的管道宣傳活動,但是卻發現有71%的註冊頁面流量,都是直接來自Facebook。

9. 評測帶來銷售
線上售車網站Cars.com發現擁有評比和評測的頁面,有16%更高的比例能將來訪數轉換成銷售,連結到經銷商網站的流量比例也高出100%,顯示評測對品牌的整體影響是正面的,負面評論出現反而能過濾掉不適合的顧客,開誠布公的態度也將能贏得信任。

10. 降低客服成本
行銷自動化及客戶關係管理軟體InfusionSoft,運用社群技術來更有效地通知客戶並讓他們隨時獲得最新資訊,也因此,過去每位客服人員平均只能對口72位客戶,藉由社群媒體的幫助,數字卻能提高到172位,達到節省企業成本的效果,而顧客滿意度也增加了10%。

Filed under , having 0 意見  

Smart phones are the future of in-car “infotainment”

2011年7月13日 星期三 by :::陽光馬戲團:::

Smart phones are the future of in-car “infotainment”

says Remy Pothet, Global Sector Head at TNS Automotive.

With more than 5 billion users on earth, mobile phone popularity exceeds that of cars (900 million). Almost every motorist is a mobile phone user and almost every new car buyer owns a smart phone! Consumer demand for compatibility is increasingly impacting the automotive industry.

Improving the customer’s driving experience

Mobile phones offer a great opportunity for car manufacturers to improve their competitive advantage. Firstly, they can help improve the customer’s driving experience. OEM’s should work closely with mobile phone manufacturers, telecom & IT providers and specialised digital agencies to develop interfaces to allow drivers to use new features in vehicles. Ford’s partnership with Microsoft to create Sync is a great example of this.

Smart phones are fast replacing expensive navigation systems as the same features are often available free. And numerous apps have been developed for drivers: locate your parked car, traffic conditions, tracking fuel costs, breakdown assistance, read emails aloud while you drive… or BMW Evolve which compares users’ driving habits to how BMW’s future electric vehicles would perform, which could help address consumer concerns about EV’s.  

Engage customers in on-going conversations

Secondly, smart phones open up an innovative channel for brand and dealer marketers to reach and engage customers in on-going conversations. Now is the time for switched-on marketers to use mobile to alert them of recalls, expiring warranties, send service reminders and advise them on future new car purchases. And of course new car buyers use their smart phone to research car purchases, especially in rapid growth markets where smart phones are the primary (if not the only) way of accessing the web.

Valuable customer feedback

Finally, mobile represents an exciting new way for manufacturers to collect feedback. Researchers analyse and interpret mobile feedback alongside existing customer data to present valuable insights which can be incorporated into the design of new vehicles.

It’s clear that mobile is influencing the automotive industry on many levels, and this is just the beginning.

Check out the world’s largest study into today’s global mobile consumer: www.discovermobilelife.com

Filed under having 0 意見  

【媒體】平板電腦如何影響民眾日常生活?

2011年7月12日 星期二 by :::陽光馬戲團:::

作者 : 那福忠
更新時間 : 2011/07/11 19:24:25

(2011-07-11)【數位媒體風向球】當民眾生活早已被智慧型手機、個人電腦、筆記型電腦等塞滿生活時,若再加上平板電腦,會有什麼影響?他們接觸媒體的習慣有什麼改變?

圖取自蘋果App Store

(Brain.com 2011-07-11)自2010年3月到現在,蘋果的iPad已上市一年多,平板電腦的熱度直線上升,漸漸影響到我們日常的活動。
根據Forrester研究機構對 iPad 持有人的研究報告,有三分之一的人減少報紙的閱讀,另有8%的人增加報紙的閱讀,大多數人讀報未有增減。在紙本書籍上,28%的人減少閱讀,另有11%的人增加閱讀,其餘未變。在印刷版雜誌上,23%的人減少閱讀,另有9%的人增加閱讀,其餘未變。紙本書報雜誌的閱讀雖各有增減,減少的顯然多過增加的,可以解釋為iPad所替代。
線上出版人協會(OPA)的最新報告說,美國有12%網友擁有或使用平板電腦,明年預估增加到23%,在閱讀上平板電腦均優於其餘媒體,有66%的人說優於個人電腦閱讀,65%的人說優於手機閱讀,58%說優於印刷版報紙,57%說優於紙本雜誌,54%說優於電子紙閱讀器。

平板電腦正在轉變我們的生活形態

Harrison集團Zinio聯合做的研究報告,說現在有28%的消費者閱讀數位書籍與雜誌,2008年僅有10%。而有平板電腦的人比沒有的人多用75%的時間閱讀報紙,多用25%的時間閱讀書本。擁有電子紙閱讀器的人,也同樣的比沒有的人多用50%的時間閱讀報紙,多用45%的時間閱讀書本,凸顯電子書閱讀器對書本的適用性。
這些平板電腦與電子閱讀器持有人多用的時間,是從哪裡來的?報告說來自上網遊逛與看電視的減少,估算這些人看電視的時間,約減少四分之一。觀察家認為這是娛樂媒體的根基變化,也是給電視主管的一個警訊。
除了閱讀,對電腦的使用也受影響。有三成的人說有了 iPad 之後就減少桌上電腦的使用,另有一成多的人說反而增加桌上電腦的使用;至於筆記型電腦,有26%的iPad持有人說使用少了,有一成的人說增多了。至於遊戲機、手機、MP3、電視,減少的人比增加的人略為增多,或是相等。最有趣的是,電子紙閱讀器如 Kindle 的使用,非但不因為有了 iPad 減少 (11%),反而加倍 (22%),可見電子紙顯示閱讀還有市場。
以上來自各方的資料,未必一致,也未必精確,但不難看出平板電腦確有閱讀上的優勢,出版業者宜視為警訊。
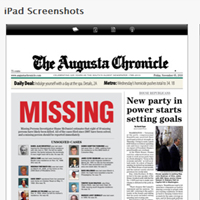
另一問題是出版內容如何在平板電腦展現,才能帶給讀者最好的閱讀經驗,現在大家都在摸索,但為了搶先,把印刷版或既有的電子版複製到平板電腦應付,也不在少數,但其中也不乏精緻製作。這裡特別介紹有 226 年歷史的 Augusta Chronicle
這家美國南方最老的報紙,今年五月 iPad 版上線,初看之下雖然似印刷報紙的 PDF 版,但瀏覽之下卻發現有相當的特色,不失為有水準的製作。
這份報紙可以選擇日期下載,除了今天的報紙,還可以下載最近一個月的報紙。下載之後每一全版佔一頁畫面,用兩隻手指觸控畫面的放大縮小、四面移動,遠比 PC 畫面用滑鼠移動便捷得多。所以 PDF 仍有用在平板電腦上效益。
放大以後的字體,立即從模糊轉為十分清晰,不像有的雜誌從 PDF 版轉成 iPad 版,字體放大就不夠清晰。除了放大字體在原頁閱讀,還可以觸摸一篇文稿,這篇立即轉到新頁,以 2.5 吋行長的可讀字體,分三欄(橫式畫面)、或兩欄(橫式畫面)編排,讓閱讀更為輕鬆。
圖片處理最特別,觸摸一張圖片,立即在原頁中間另開一圖片視窗,顯示這張圖片。但顯示的不止這一張,凡與文稿內容相關所有的圖片,都「藏」在圖片視窗,都可用手指左右撥動觀看,看完圖片手指一點,圖片視窗消失,回到原頁。這份報紙或許沒按著一般的 iPad App 另行設計,卻能讓讀者舒適閱讀。
平板電腦不過是一種工具,哪一種工具能讓出版業運用得法,帶給讀者便捷舒適的閱讀經驗,就是贏家。現在叫平板電腦,幾年以後還不知道會叫什麼。

Filed under having 0 意見  

Why Competing with Apple Is So Difficult

by :::陽光馬戲團:::

Ben Bajarin is the Director of Consumer Technology Analysis and Research at Creative Strategies, Inc, a technology industry analysis and market intelligence firm located in Silicon Valley.

The desire to compete with Apple is widespread among many companies in the tech sector. The problem is that very few, if any at all, are well equipped as businesses to compete head on with Apple as very few have the same kind entrepreneurial culture as Apple.

Around 2005, our firm, Creative Strategies, began receiving more in-depth questions about why Apple is so successful. We were asked to do more specific analysis on Apple's strategy to shed light upon what some refer to as the “secret sauce” that drives the company. Much of this was because the success of the iPod was bringing Apple new customers in droves. And when the iPhone was launched, interest in Apple skyrocketed even higher.

Vertical Integration

But competing with Apple is difficult because Apple, Inc. is actually four diverse and thriving companies all wrapped up into one. It's a hardware company, a software company, a services company, and a retail company. Most technology companies in the world can manage one or two of these disciplines, but only Apple has all four entities working in harmony.

Apple, as we say, is vertically integrated. It controls all the major critical parts of the chain used to make and sell products. Apple builds great hardware, owns the core software experience, optimizes its software for that hardware, equips it with web services (iTunes and iCloud), and finally controls the selling experience through its own retail stores.

(MORE: How to Sell a Tablet: Apps and Price First, Tech Specs Second)

In contrast, most other PC, smartphone and tablet vendors make the hardware (Dell, Toshiba, Motorola, Samsung, etc), put someone else's software on it (Windows and Android), add third party services (Google, carrier services, etc.) and then sell it through someone else's store (carrier retail stores, Best Buy, etc.)

Competing with a company as vertically integrated as Apple means that PC and consumer electronics companies can, at best, compete with Apple in only one or two disciplines. While they might be able to create similar hardware, their lack of control of the operating systems as well as the services that are tied to these operating systems gives them little control over their markets. And no vendor has shown so far that it can compete with Apple in retail.

The only company that has even come close to being in a position to compete with more than two of Apple's core business strengths is HP. Its acquisition of WebOS is the primary reason, because now it can make hardware and the operating system software, and ultimately have more control of the user experience.

(MORE: HP Is Committed to Its 'WebOS' Platform (and It Should Be))

Even then competing Apple is difficult, because the company has proven to be a viable force to be reckoned with across all the areas within which it competes. In fact, if we take a hard look at the consumer and personal electronics landscape, we would be hard pressed to find a better hardware, software, services, and retail combination in the marketplace.

Technology as Art

Beyond that, Apple also has a culture that is completely unique, which is another part of the reason for its success. Steve Jobs in his many keynotes has pointed out that Apple's approach to products is that they are at the union of liberal arts and technology. And nobody in the industry so far has been able to match Apple's eye for design.

What this means is that there is an added dimension of design and technology as art that influences the thinking of those who work at Apple. This group is like a passionate team of artists who happen to turn their art into technology.

This is the major reason that Apple emphasizes simplicity. Steve Jobs has in many keynotes and demos said that Apple's various products "just work." What we must not forget, though, is that creating technology products that are simple is no trivial task. Simple solutions require sophisticated technologies. Apple knows this better than anyone and it has oriented itself to succeed at just that.

The advice we give to our clients is to pick their battles. They simply aren't oriented to compete on every single playing field as Apple.

MORE: Tablets: 'Why Should Somebody Buy This Instead of an iPad?'

Read more: http://techland.time.com/2011/07/01/why-competing-with-apple-is-so-difficult/#ixzz1RslckpLN

Filed under having 0 意見  

HOW TO: Optimize Marketing Copy For Mobile

by :::陽光馬戲團:::

The Mobile Content Series is supported by Mygazines, the better way to enhance and distribute brochures, catalogues, newsletters and other documents on every device. To complement this post, view an exclusive videocast, “Mobile Content Delivery: Native App Vs. Web App”.

When writing copy for any medium, it’s easy to drown in a sea of lead-ins, clever anecdotes and introductory sentences. There’s hardly time for that on the web. Marketers don’t have the luxury of leading up to anything. The only option is to be direct.

Website visitors typically won’t read big blocks of copy — they want to get in and out and move on to the next site. Think of copywriting for mobile as distilling down web copy even further. If web copy is skimming the cream off the top of the milk, mobile copy is skimming cream off of the cream.


What Makes Mobile Unique?


Users on the web are notoriously distracted and hop around from page to page. Mobile users are distracted even further. Their devices are buzzing with push notifications from their apps, text messages and emails are constantly popping up on the screen. They might be standing in line at a grocery store, waiting for a movie to start, in a taxi, in an elevator or walking down the street. These scenarios — and mobile use in general — are defined by three key factors:

  • 1. Pockets of Use. Picking up their mobile device is a secondary task. They’re just trying to fill up a pocket of time while doing something else. Users have just a few moments to check their phone or look up a piece of information while they’re completing a primary task (waiting in line, elevator, etc.).
  • 2. Perpetual and Inherent Distraction. Traditional web users may face distraction from email, chat and the infinite number of other webpages they could be on, but when those users land on a page, they typically stick around until they become bored or want to check out some other piece of information on the web. Mobile users, on the other hand, face perpetual off-device distractions — use of their mobile device is secondary. Byrne Hobart, founder of investment research firm Digital Due Diligence, observes that mobile marketers are “writing for an audience that’s in the middle of something else.” They might be waiting for their subway stop, their floor on an elevator, their line to be called at Whole Foods, a friend to show up at a restaurant. Point is, the number of off-device distractions for mobile users is limitless.
  • 3. The (Very) Small Screen. Mobile devices have tiny screens — they simply do not fit a lot of content. It’s critical that marketers keep this in mind as they write copy. What will fit onto a user’s screen without scrolling?

Mobile Is How We Live and Communicate


When creating mobile content, keep in mind what it represents. For many users, their phone is the headquarters of their lifestyle. It’s a connection to friends, family and coworkers. It’s a locker for nostalgic photos and texts from last night that probably should be deleted. Users personalize the background, download apps that fit their needs and look up information on the go. For many users, their phone is the first thing they see when they wake up and the last thing they see when they go to bed. It’s by their side 24/7, and it’s their connection to the world.

Marketers — and everyone else — should keep this in mind as they create content for mobile. Here are some things to consider when writing for mobile.


Be Goal-Oriented


The Hyperfactory‘s Joanne Eberhardt notes that the best mobile content “cuts copy to a minimum and only spews the necessities — necessities being what your target should see during those fateful two seconds that determine a click/tap.”

Hobart suggests that content be laser-focused on a specific task. “People are less inclined to meander on mobile apps and web — they’d rather meander in the physical world, given the choice.” Create content focused around your goals and avoid going on tangents — mobile users simply don’t have time or interest.


Use Strong Headlines: Think Like You’re Tweeting


When I reached out to the Grand Hotel group’s head of digital, Steven Rojas, he insisted that this interview be conducted over SMS to ensure the conversation was mobile-content-friendly. Rojas manages a number of Twitter accounts, so I asked him to share his secret for perfect mobile content. It’s easy he says, “Make it quick. Make it smart. Make it witty. And above all make it retweetable!”

Even if you’re not writing a tweet, think about the word “retweetable.” Really, what Rojas is eluding to is that the best mobile content is tweet-worthy, even if it’s not being written for Twitter. Mobile copy should be very much to the point while sacrificing as little power as possible. Get an idea across quickly. To do this, content will have to be quick and clear so that users get the point right away, but with just enough mystery and intrigue to encourage them to continue reading and to also share the content with others.


Screen Sizes Vary Among Mobile Devices


When writing copy for the web, space on the page allows for visual cues that can draw the readers’ eye towards the marketer’s objectives. Anna Lindow, director of marketing strategy at personal finance startup Bundle, points out that “when it comes to mobile, copywriters have to place extra consideration on being extremely direct, clear and succinct, because presentation options will likely be limited or even inconsistent across devices and platforms.”

Sam Altman, CEO of Loopt, has spent a lot of time thinking about the best way to create a mobile experience. Altman stresses that “it’s important to get your brain to think within the confines of a small, mobile screen and avoid the tendency to think big and then just shrink it.” The “shrink it” mentality just creates more cycles and more iterations. “If you switch your thought process, you’re more likely to get it right the first time,” Altman explains.


Frontload Your Content


Most of the time, people are only going to read headlines or the the first couple lines of marketing content. Therefore, it’s important to put the most important content up front. Don’t hold back and don’t rely on leading up to something big. Put the big reveal up front!

Think about how readers will browse the content. Try to avoid requiring too much clicking, but you also don’t want long pages that require a lot of scrolling. The way to do this is to be concise and efficient with your words — minimize the number of pages that readers have to click through. Try to keep content on a single page, if possible. But don’t cram so much onto a page that the site takes a long time to load — users will give up if they have to wait too long.


Test Your Content to See What Performs Better


Eberhardt encourages clients to experiment and find a balance between information and space. “It’s a continuously evolving industry with technology and trends, and you cannot be afraid to make waves,” she says. Marketers and clients too afraid of turning away possible clicks or downloads sometimes end up creating extremely safe and dull material.

One way to find out what works is to test two versions of your copy. Use tools like Google Website Optimizer to try out two (or more) versions of your content. A/B testing tools allow marketers to pit two versions of the same content against each other. The software splits users into multiple groups, showing different versions of the content to each one, and then automatically selects and implements the content that results in the most conversions, whether that be click-through rate, time on site, etc.

You should also use humans to test the content, as humans will be reading it. Nearly all mobile content is created on desktop computers with big screens, desktop browsers and a mouse. You should have a few people play around with the site on a real mobile device — not simulators — to provide feedback on usability and readability.


Copywriting for Apps


Generally, content for apps should follow the same rules as any other copy for mobile, but there’s a bit more to take into account. When it comes to apps, usage will be a bit more deliberate than the general web. While users on the web could be looking for anything, app users tend to be a bit more focused. They are actively opening an app, so bigger imagery and more text might be appropriate, especially because it’s built into an app and thus won’t have to load over often-shaky mobile connections.


Conclusion


Creating content for mobile isn’t the same as creating content for the desktop web. Acknowledging and embracing that fact is key to successful copywriting for mobile. Think about the limitations of small screens, constant distractions and low-quality mobile web connections. And don’t forget to try your content out on real humans using real mobile devices. Readers on the go want bite-sized information that will serve them in that very moment. Give them what they want.


Filed under having 0 意見  

Web Analytics and Optimization for Content Sites

by :::陽光馬戲團:::

Posted on August 21, 2007 by Mike Sukmanowsky

A common problem that faces many organizations hosting a strictly content-driven website is how to turn the data thrown out by any of the applications out there into something you can monetize. Sure, more page views mean more impressions which means more cash for your company, but what if you’re tagging a series of event-based activities (see Best Practices – Tagging Flash Files) which don’t generate additional impressions? Then the influx of page views you begin reporting isn’t actually contributing anything towards your bottom line, but it’ll certainly seem like you’re having a stellar quarter from your analytics reports.

(Side note here: this kind of thing can be solved with a separate profile that filters out all the “extra” activity you’ve tracked along the way)

The metrics I follow for content-based sites that heavily rely on advertising dollars to fuel revenue can be grouped into three categories, which in tern actually lays out the analytics and optimization strategy for these sites:

  • Growth
  • Loyalty and
  • Engagement

All content-driven sites generally want to tell the same story of growing their visitor base and keeping them coming back constantly while they consume (engage with) more and more content on the site. Before I go any further, let’s take a second to get our heads around why this is a model for success.

Why should I care?

At the heart of content-driven sites is ad revenue which is provided via impressions. Companies usually agree on a Cost per Mille / 1000 (CPM) impressions delivered and just like that, we have revenue. So at first the initial thought throughout the industry was “more page views = more impressions = more $$$”. This wasn’t a bad way to think about things, after all page views are a measure of engagement with your content, and page views is a metric that’s easy for anyone to monetize.

The problem lies with the fact that focusing on this one metric got people spending and focusing on the wrong things. In desperate efforts to drive up ad revenue that was likely tied to many people’s bonuses, site owners looked towards acquiring more visitors as their best bet to drive up page views. Efforts like SEO and SEM were seriously utilized in order to drive as many eyeballs to your site as possible – why? Because that’s all that advertisers cared about.

But there was an underlying problem with this method; driving a bunch of people to your site that hate what you have to offer is analogous to a leaky bucket. You keep pouring in money towards your acquisition strategies, but you never realize return on your investment when all your visitors just pop in and pop out of your site. Also, it becomes hard to charge higher CPMs to your advertisers if all you have to offer them is “500,000 people came to our site last month…but only 10% clicked through and only 5% ever returned.”

The other problem with the “grow first, ask questions later” model, is that without engaging content, you’re never getting the maximum amount of value out of the visitors you attract to the site.

Say I have a site with average monthly visits (not visitors) of 500,000, the average number of page views per visit of those visitors is 2, the average CPM for all my inventory is $10 and the average number of ads per page is 3. Using these numbers, my monthly ad revenue is (500,000 * 2 * 3) / 1000 * 10 = $30,000. Now assume that by focusing on optimizing my visitor’s site experience (see Bryan and Jeffery Eisenberg’s Book), I’m able to drive page views per visit up to 4. Note: I didn’t grow my visitor base at all, I simply got that visitor base to look at more of my content. The result? An incremental increase in monthly ad revenue of $30,000 a yearly increase of $360,000. And I didn’t even have to spend a dime on SEM and SEO – see what your CEO thinks about that!

What the above discussion hopefully demonstrated is a successful acquisition strategy is just one component to a content-driven site’s success. Once you’ve driven more people to your site, you want to keep them and you want them to love what you have to offer and there we have growth, loyalty and engagement.

Ok, I get why this is important…but what do I do?

Oddly enough, the easiest part of the growth, loyalty and engagement strategy is actually growth. There are plenty of methods out there to grow your visitor base (namely SEO and SEM), but it’s far more difficult to have a loyal visitor base and one that engages with your content.

What I recommend then is a backwards approach. First focus as much as possible on delivering engaging content to your visitors, then move onto looking at ways to improve loyalty and finally examine your growth strategy. The result of this strategy is a far higher return on all the dollars you’ll spend at your growth stage as well as, and this is far more important in my book, a far greater site experience for your visitors.

Great, but how do I know I’m delivering engaging content?

This is where web analytics fits in. The metrics (they’re actually key performance indicators (KPIs), but no worries) I prefer to use to gauge how engaging your content is are pretty simple (many of which borrowed from Eric T. Peterson):

  • Average Pages Viewed per Visit
  • Average Time Spent on Site
  • Percent of Visits Greater than 60 Seconds
  • Percent of Committed Visits (> 5 page views per visit)

The above metrics are available from most tools, but let’s take a look at how to grab them from Google Analytics.

Average Pages Viewed per Visit and Average Time Spent on Site

Both of these guys are pretty easy as you can grab them right out of your dashboard report as soon as you open up your profile.

Just look for Pages/Visit and Avg. Time on Site.

Percent of Visits Greater than 60 Seconds

60 seconds is a threshold you can adjust depending on the content on your site. 60 seconds may be too long or too short for the type of content you have so you’ll have to use your discretion. Google Analytics also won’t often allow you to grab the specific segment you’re looking for so you may have to suffice for something different.

As for pulling this data, navigate to your Length of Visit report which can be found under Visitors -> Visitor Loyalty. Feel free to add this report to your dashboard for easy reference later on. You’ll likely have to do a little bit of addition to get the number you’re looking for, but that’s no biggie.

Percent of Committed Visits (> 5 page views per visit)

Again, this is a metric that can be adjusted if needed. 5 page views per visit may be a bit too much or too little to be considered a committed visit. To pull this information, navigate to your Depth of Visit report which can be found under Visitors -> Visitor Loyalty. Feel free to add this report to your dashboard for easy reference later on. You’ll likely have to do a little bit of addition to get the number you’re looking for, but that’s no biggie.

Cool! Now onto loyalty…

It’s logical to assume that really terrific, engagement content should always keep people coming back for more, but these days that may not be enough. What I try to remember is that the internet space is no different from any other and the dot com crash proved that. A truly unique value proposition that gives me (as a visitor) something I can’t get anywhere else and delivers incredible value at a low price (price doesn’t have to be in dollar amounts, what about my time and patience?) will always make me want to return. The name of the game is satisfaction.

Your best metrics to gauge how well you’re doing at keeping a loyal visitor base then are:

  • Percent Returning Visitors
  • Percent Loyal Visitors (> 5 visits per month)
  • Average Visits per Visitor

Percent Returning Visitors

The number of returning visitors (actually, this is visits in Google Analytics) as a percentage of your entire visitor population for a given time period. This data can be pulled from the New vs. Returning report which can be found under the Visitors menu. Feel free to add this report to your dashboard for easy reference later on.

Percent Loyal Visitors (> 5 visits per month)

As usual, adjust the “> 5 visits per month” threshold to whatever makes the most sense to you and your site’s content. If the site is updated every day, loyal visitors may be those visiting more than 15 times a month.

To pull this data, navigate to the Loyalty report which can be found by navigating to Visitors -> Visitor Loyalty. Feel free to add this report to your dashboard for easy reference later on. You’ll likely have to do a little bit of addition to get the number you’re looking for, but that’s no biggie.

Average Visits per Visitor

This one is pretty well a no brainer, we’d all like to see the average number of visits per visitor improve but you’ll still have to work on baselines as to what’s appropriate for this KPI. You can calculate this metric directly from your pre-configured dashboard. Just divide visits / visitors.

Woo hoo! Now onto growth!

As previously stated, growth is probably the easiest place to improve upon in this three prawned strategy. Your most popular acquisition sources will likely be SEO and SEM, but there’s all sorts of partnering to be done with other content sites, affiliate networks and plenty more. Don’t let keyword buying occupy your entire acquisition universe and make sure to evaluate the success of your keyword buys by looking at the growth, loyalty and engagement metrics for just that section of visitors (you’ll have to create a new profile to do this).

I should probably note that I say “easy” in that growth has the most easily available options to you for improvement. However, actually picking the right targeted sources is by all means not easy and many marketers have to struggle with these problems everyday (hence the birth of behavioural targeting).

That being said, your two best metrics for evaluating how well your growth strategies are working overall are:

  • Percent New Visitors
  • Ratio of New to Returning Visitors

Percent New Visitors

The percent of new visitors (or visits in Google Analytics) can be an interesting metric to monitor when employing a high powered SEO/SEM strategy in that you want to ensure your efforts aren’t attracting an existing visitor base. This data can be pulled from the New vs. Returning report which can be found under the Visitors menu. Feel free to add this report to your dashboard for easy reference later on.

Ratio of New to Returning Visitors

Finally, the ratio of new to returning visitors provides an excellent way to understand what strategy your site is pursuing (whether intended or not). For example, a ratio of new to returning visitors of 3 would say, “for every visitor that returns, I bring 3 new ones in”. Ideally speaking, you’d like to see a ratio of new to returning visitors of around 2 in order to keep a healthy growth rate, but ensure that enough of your growing audience is still returning.

A ratio that’s higher than 2 indicates your site is in “growth mode” and your acquiring more visitors than you’re keeping. A ratio that’s lower than 2 indicates that although you’ve got a very loyal audience, you may want to look into some ways of growing it out.

This metric can be pulled from the New vs. Returning report which can be found under the Visitors menu. Feel free to add this report to your dashboard for easy reference later on.

Now tie it all together…

Just in case anyone got a little side tracked with that run thru let’s put those metrics in perspective again:

Growth

  • Percent of New Visitors
  • Ratio of New to Returning Visitors

Loyalty

  • Percent Returning Visitors
  • Percent Loyal Visitors (> x visits)
  • Average Visits per Visitor

Engagement

  • Average Pages Viewed per Visit
  • Average Time Spent on Site
  • Percent of Visits Greater than 60 Seconds
  • Percent of Committed Visits (> x page views per visit)

Finally! Now that we’re all on the same page about why growth, loyalty and engagement are the aspects to a good strategy for content-based sites and we have the accompanying metrics to evaluate the success of that strategy we’re set for success! Of course I’m leaving out a big part of the strategy for success which are the actual changes to make in order to improve these metrics, but that’s supposed to be the fun part that’s left up to you!

Filed under having 0 意見  

快速消費產品 (FMCG) 的快速行銷之道

2011年7月10日 星期日 by :::陽光馬戲團:::

產業新聞, 21.06.11

六十年前,電視、廣播和平面媒體支撐起廣告界的一片天,消費者只能被動地接受廣告主所傳遞的訊息。時間軸拉到今日,由於數位頻道、種類、工具的爆炸以及數位內容的多樣豐富,廣告主有了更多的平台可供選擇,但消費者變得更不容易掌握,廣告訊息必須強調即時性、關聯性、參與性和互動性,尤其鎖定大眾消費群的快速消費產品,行銷競爭更是前所未有的激烈。就行銷工具的選擇上,網路廣告除了能讓廣告主在有限預算下達成以上目的外,也能提供較高的效益及投資報酬率。從另一層面來看,網路更提供了一個整合的平台,讓產品能進一步與消費者產生互動進而刺激消費行為
舉例來說,以往電視廣告只能透過買時段的方式粗略的鎖定目標觀眾,而廣告主也只能從收視率評估廣告效益,但隨著網際網路的發達和社群媒體的蓬勃發展,電視廣告可以迅速在社交媒體上竄紅,而消費者可以用「讚」來表達對一個產品或品牌的支持,也就是說電視廣告在網路世界裡有了更多可以針對潛在客群的曝光機會。對廣告主而言,如何在眾多網路媒體中選擇最有利的平台、如何設計出引發目標族群共鳴的內容及提供創意的互動將是從眾多競品中脫穎而出的關鍵。
當今媒體趨勢: 網路+電視

尼爾森針對12-65歲的受訪者進行一年一萬份的調查,發現過去10年中,電視的昨日接觸率表現持平,而報紙、雜誌、廣播則下滑10%左右,唯獨網路媒體呈現逐年成長的態勢。十年前,網路的昨日接觸率不到20%,而2010年第三季已經來到52.2%,成長幅度超過兩倍,直逼報紙10年前的昨日接觸率,並且在2007年首度超越報紙。由此可見,電視及網路已是當今媒體的兩大主流。那麼在一天當中,兩種媒體的使用狀況又是如何? 經調查發現,15-49歲的受訪者,於平日的一天24小時中,有17小時的時間網路使用人數高於電視收視人數,且其高峰點剛好落在電視高峰的前後,這意味著網路提供了一個與電視廣告互補的平台。

尼爾森研究指出網路搭配電視的廣告行銷活動,會帶來一加一大於二的成效。回過頭來看實際的廣告投放會發現,網路廣告存在大量的成長空間。2010年電視廣告量達244億,而網路廣告量(就橫幅廣告部分)僅有46.5億的規模,與網路可以接觸到的人口比例來說,如此的投放量顯然不成比例。

擁有廣大用戶  MSN是最佳數位行銷平台
台灣網路資訊中心5月24日公布最新統計,台灣地區上網人口已達1,695萬,與去年相較上網人口成長了73萬人。而根據創市際市場研究顧問公司3月份所做的調查,MSN接觸人口將近1,000萬,換句話說,平均每1.7個上網人口就有1個人使用MSN平台。若更進一步探究使用者輪廓會發現,19歲以下的用戶占了13%,而20-39歲占了63%; 上班族占了50%,學生則占了30%。此外,Windows Live Messenger已是台灣第一大即時通訊,用戶高達800萬,微軟內部監測資料等研究數據亦指出:平均一天使用人數達260萬; 用戶平均一天登入4次且使用時間長達3小時; 透過Windows Live Messenger發送的訊息每天每人約53則; 使用者好友名單約有100個(亞洲排名第三); 使用的高峰期為早上9-12點、下午2-6點以及晚上10點以後,若與整體網路使用狀況相較,會發現兩者高峰時段相互呼應。

MSN祭出吸睛四大法寶 要消費者好看
既然廣大消費族群對MSN平台有了相當的黏著度,接著就要來看,微軟數位廣告如何藉由MSN這個強大的數位平台協助廣告主提升品牌或產品知名度及好感度。法寶一: 在Windows Live Messenger上設計有趣好玩的表情符號或互動遊戲,透過網路的號召力與感染力提高廣告產品印象; 法寶二: 利用MSN頻道資源,量身訂做合適或搭配時事的廣編特輯或品牌專題,達到精準深入的溝通; 法寶三: 透過高畫質Silverlight製作呈現影音專屬平台或多媒體影音廣告,吸引消費者目光; 法寶四: 不管是網路或實體的聯名合作,小綠人為MSN所創造的品牌價值可間接為廣告商品帶來正面加值並創造話題。關於上述四種數位行銷工具的實際應用,可參考水果變聖代,數位行銷四大心法讓品牌滋味更誘人
精彩案例分享一: 黑松茶花 花太郎縮哩篇
黑松茶花在市場上已經打開知名度,唯仍需要藉由持續的廣告露出達成品牌形象的延續、溝通產品雙倍升級的訊息,以及全面提升品牌的好感度。業主選擇Windows Live Messenger平台作為整體廣告訊息的擴散延伸,利用MSN提供的IM樂分享、Personal Expressions主題封包及創意視覺內容延續產品話題性,並利用社群媒體達到與目標客群互動。該行銷活動一共吸引將近30萬網友造訪活動網站,且Rich Media的點閱率達 3%。

精彩案例分享二: 薇閣精品旅館大直店開幕
業主欲利用薇閣小電影作為與競品區分的賣點,並以不同以往的廣告呈現方式挑起消費者前往消費的慾望。微軟數位廣告為業主做了一系列的線上廣告活動,包括在MSN娛樂影音館搶先首播引爆話題; 利用MSN娛樂頻道播放電影預告片,提供電影時刻表及簡介,邀請消費者到電影院欣賞; 以及充分利用無須進行線上搜尋即可觀看的Messenger瘋狂影音秀 (且考慮到影音內容,微軟數位廣告利用Targeting技術鎖定18歲以上的用戶)。該行銷活動在推出後短短兩周內創造了10萬個點選,而與MSN合作的電影頻道置入行銷在網路上亦引發了超過2萬5千個議題討論。

Filed under having 0 意見  

蛇打七寸!掌握網路使用者行為與思維的關鍵報告

by :::陽光馬戲團:::

研究報告, 17.06.11

難捉摸的網路使用者行為樣態一向是行銷人員最想搞清楚的秘密,隨著人們的網路媒體使用素養逐日提昇,你知道網友的使用動機與行為模式又已悄悄產生改變了嗎?藉由一份由Microsoft Advertising與MEC、Mindshare所共同進行以網路使用動機為主題的跨國與跨年代(2007-2010)之研究報告,將可讓行銷人員對目前網路使用者的行為樣態與思維有更精準的掌握,以能進一步擬定更投其所好且有效的行銷策略。
這些年,網友的上網動機與行為產生哪些改變?
研究顯示,2010與2007相比,網路使用者的上網動機與行為模式有了下列變化:

  • 動機的改變:網友上網仍是以「溝通」為最主要動機,例如使用即時通訊服務、收發電子郵件等。值得注意的是,例如寫網誌、上傳照片與影片等「創作」動機強度在這次研究裡被發現有明顯的提昇。
  • 行為的改變:發現與2007年相比,網友從事資訊搜尋行為(例如搜尋某一件特定新聞或產品相關資訊)的時間比例有下降趨勢(減少3%),反倒是線上觀看/下載影片、玩線上遊戲等娛樂使用行為有明顯提昇(上升8%)。

不再無所事事的閒晃,現在的網路使用者上網是更具理性且有計劃

  • 過去當網路環境還較為單純時,使用者在網路上從事的活動大同小異,但隨著這幾年網路服務的推陳出新(例如微網誌、新型態的社交媒體)以及各種可連網的手持裝置相繼問世,不僅提供更多網路上的活動選擇、同時也加深了網友彼此間在使用行為上的差異化。
  • 相較過去,使用者上網時間有下降趨勢、同時並減少盲目在網路上閒逛的時間(使用者漫無目的上網的時間比例已從2007年的39%下降為2010年的21%)。此亦表示現在人們上網是目的導向且更效率化。此現象又以較早導入網路的歐美更為明顯。
  • 另外研究還發現,若把上網比喻成一趟旅行,發現人們每次上網多會先使用與私人有關的活動(例如社交網絡、個人部落格、檢查電子郵件),接著才會看看新聞、找尋娛樂、網路購物等進行較偏公領域的活動,但有趣的是最後要下線前,又會再回到私領域的使用項目。

手持裝置上網行為初探

現在正夯的可連網多點觸控式手持裝置使用者之上網行為又是如何?研究發現:

  • 手持裝置因為攜帶方便且可一直連網,因此不像電腦上網會有明顯高低峰的使用時段。
  • 在網路使用動機上,和電腦上網一樣,「溝通」也是手持裝置上網最主要的目的。不過在「娛樂」與「線上交易」動機上則明顯較電腦上網來得低。


對行銷人員的啟示
隨著使用者上網行為的理智化與目的導向,傳統網路廣告很難再發揮效果。若網路廣告想要引起網友注意,必須深入思考使用者的上網行為脈絡與背後動機,將品牌訊息很自然的置入在使用者主動接觸的內容或網路服務裡頭才不致引發反感。
例如在行為脈絡上,網路在一天中的不同時段扮演了不同角色,所以行銷人員應該要在不同時段發揮創意、靈活地以不同訊息與內容來跟使用者溝通。而在使用者上網的動機部分,「溝通」仍是目前上網最主要的動機,另外同樣不可忽略的還有「創作」動機的重要性,若考量這兩項上網動機,行銷人員即可思考如何運用創意來吸引使用者藉由廣告主所提供的一些小工具來共同創造他們會覺得有趣、有意義的內容,然後熱情分享給親朋好友。
因此簡而言之,現今廣告策略需以巧「拉」方式取代傳統的強「推」形式。同時再靈活運用「付費」(Paid)、「擁有」(Owned)與「賺到」(Earned)等不同的行銷訊息刊載方式、多管齊下,以攫取使用者目光與提昇對品牌的好感度。更高者,所傳遞的訊息若能協助使用者滿足該次上網的需求、幫助他們達成任務或讓他們從中得到樂趣,此又將更會是成功有效的品牌互動操作。

Filed under , having 0 意見  

The Web Is Shrinking. Now What?

2011年7月8日 星期五 by :::陽光馬戲團:::

We all read the statistics every week documenting the meteoric new growth areas of the Internet, and they are impressive:

Online video is exploding, with annual user growth of more than 45 percent. Mobile-device time spent increased 28 percent last year — with average smartphone time spent doubling. And social networks are now used by 90 percent of U.S. Internet users — for an average of more than four hours a month.

None of this is a newsflash. Every venture capitalist, Web publisher, and digital marketer is hyper-aware of these three trends.

But what’s happening to the rest of the Web?

The Web Is Shrinking. Really.

When you take these three growth areas out of the picture, the size of the hole left behind is staggering: the rest of the Web — the tried and true core that we thought would have limitless growth — is already shrinking.

Here are the facts:

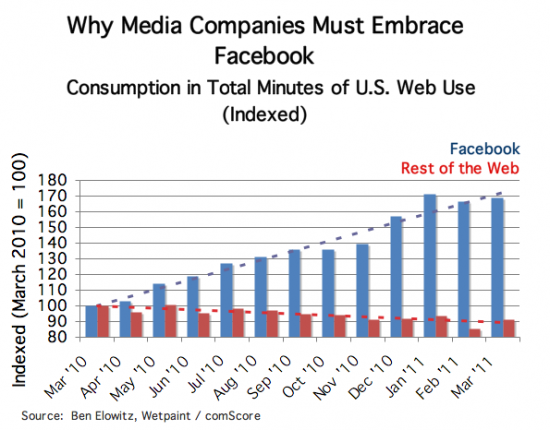
When you exclude just Facebook from the rest of the Web, consumption in terms of minutes of use shrank by nearly nine percent between March 2010 and March 2011, according to data from comScore. And, even when you include Facebook usage, total non-mobile Internet consumption still dropped three percent over the same period.

We’ve known that social is growing lightning fast — notably, Facebook consumption, which grew by 69 percent — but now it’s clear that Facebook is not growing in addition to the Web. Rather, it’s actually taking consumption away from the publishers who compete on the rest of the Web.

And just what is the rest of the Web?

I have been calling it the “document Web,” based on how Google and other Web architectures view its pages as documents, linked together. But increasingly, it might as well be called the “searchable Web” since it’s accessed predominantly as a reference, and navigated primarily via search.

And it’s becoming less relevant.

In the last year, Facebook’s share of users’ time online grew from one out of every 13 minutes of use nationwide, to one out of every eight. In aggregate, that means the document Web was down more than half a billion hours of use (that’s more than 800 lifetimes) this March versus last March. And in financial terms, that represents a lost opportunity of $2.2 billion in advertising inventory that didn’t exist this year.

The Creation of a New, Connected Web

The change in the Web’s direction is a clear indication to me that we aren’t just in the midst of a boom for new interaction modes, but rather in a generational overhaul of the Internet.

What replaces the declining searchable Web is a new and “fully connected” digital life. You may have heard this before. After all, the promise of the Web was to connect pages with hyperlinks. Well, this time, “connected” means much more. It means the Web connects us, as people, to each one of the individuals online; and those connections, ultimately, extend from one of us to all of us.

Just as significantly, this all happens in real time, and at nearly all times.

And here’s what’s different when you connect people, as opposed to pages: Now, the Web knows who we are (identity), is with us at all times wherever we go (mobile), threads our relationships with others (social), and delivers meaningful experiences beyond just text and graphics (video).

The connected, social Web is alive, moving, proactive, and personal, while the document Web is just an artifact — suited as a universal reference, but hardly a personal experience.

The Social Web Versus the Searchable Web

Analytical explanations — increasing smartphone penetration, bandwidth availability, and technology sophistication — fill in some of the gaps as we try to understand this sea change, but they fall short.

Something larger is afoot, and it’s not about science or technology. Rather, as human beings, we have changed how we fit the Internet into our lives.

And the nature of the Web is changing to match. The old searchable Web is crashing; while the new connected, social Web is lifting off.

The implications for publishers are massive.

The last decade has been defined by the rise of Google as the nearly limitless supplier of traffic to digital media properties. And so a generation of digital media publishers developed and followed the same playbook: create lots of content around top keywords, engineer for search engine optimization (SEO) and expand the surface area in search engines to reach more users. The objective was to catch visitors in their net; expand reach — as measured by ComScore — look more impressive to advertisers and capture more demand.

The landscape is changing, and fast.

SEO’s strategic value is quickly fading as Google’s growth slows and its prominence in distribution slides away. In its place, Facebook has become the wiring hub of the connected Web — a new “home base” alternative to Google’s dominance of the last decade. Facebook began receiving as many visits as Google in March 2010, and already garners more than three times as many minutes as Google each month from users, according to comScore. Looking ahead, the best projections of U.S. online reach indicate that Facebook will surpass Google on that metric in less than a year, too.

And with this change, the nature of the relationship between users and publishers is being altered fundamentally — and perhaps forever.

Search offers a utility relationship, connecting users to content for the briefest of transactions; typically, it provokes users to just one pageview so they can find a piece of information, and then they move on.

But social discovery builds a relationship. Leveraging social endorsements and an environment of serendipitous discovery, consumers meet publishers in a meaningful context. As a result, the relationship that forms is stronger — and, more importantly for publishers, it’s branded.

Unlike the ecosystem set up by Google, where the search engine ironically intermediates between users and the objects of their queries (so that users reinforce their loyalty to Google, far more than to the publisher), in the world of social publishing, the Facebook hub enables a direct, if constrained, relationship between users and media brands.

The results — at least for my own company, Wetpaint — are that social media brings more qualified eyeballs and retains them. People who come via social media stay longer on the first visit; and they are more likely to come back sooner and more frequently. Overall, our visitors from social networks have a relationship that’s several times stronger — and several times as valuable when measured in engagement, pageviews, and revenues — than the relationships people form when then arrive through search.

The Human Connection

But it’s not just a change in mechanics. It’s a change in our human relationships.

Lewis D’Vorkin, the Chief Product Officer at Forbes, speaks of it when he and Alex Knapp talk about “live” media, quantum entanglement and mutually rewarding relationships that bind authors and readers on the new connected Web. It’s a sense of the Web moving from static published reference to living digital companion.

But there’s even more, and this vast change foreshadows bigger and better impacts on our lives. The greatest innovators in social media are driving exactly along that edge today. As one friend commented recently on the full potential of connected lives, by being joined more closely together, we can increase empathy and meaning, while decreasing isolation.

Toward a Fully Connected Future

Admittedly, we’re early in the replacement cycle when it comes to the connected Web. Even for strong connected Web performers like Huffington Post, Wetpaint, and others, the sum total of traffic from Facebook, Twitter, video, and mobile may add up to only half the total, or less.

But the trend has tipped, and with that tip has come both the business necessity and the human impact potential of elevating the relationship.

As the document Web of old shrinks, the new connected Web expands and delivers experiences that make our time online more effective, efficient, and enjoyable.

And that changes the role of companies on the Web from mere content publishers or providers to truly connected digital partners for real people.

Ben Elowitz (@elowitz) is co-founder and CEO of web publisher Wetpaint, and author of the Digital Quarters blog about the future of digital media. Prior to Wetpaint, Elowitz co-founded Blue Nile (NILE). He is an angel investor in media and e-commerce companies.

Filed under , having 0 意見  

Web 正在萎縮,現在怎麼辦?

by :::陽光馬戲團:::

我不知道你們有沒有注意到幾天前「The Web Is Shrinking. Now What?」這則消息?上面這張圖,我第一次看到的時候還蠻震驚的。它基本上的意思是過去一年來,消費者花在 Facebook 上的時間成長了將近 70%,而花在其他網站的時間則減少了 10%。

從開始寫這個網誌以來,我就一直喊 Web 3.0 來了Web 3.0 來了 – 我承認 Web 3.0 這個字還蠻蠢的,但是我找不到另一個字更能夠一口氣代表網路業正在經歷的這幾場革命,包括 Social Web, Mobile Internet, Curation, Social Media 等等。其中 Facebook 一年多前開放的 Open Graph 平台,正是加速 Social Web 到來的最重要動力。

喊歸喊,我倒是沒有料到 Social Web 真的來得這麼急、這麼猛,居然已經開始造成「Rest of the Web」的萎縮。我去演講的時候常常做田野調查,問問大家起床第一件事情是看 Facebook 的,和睡覺前最後一件事還是看 Facebook 的,的確在過去這一年來有著顯著的上升,大約從 3 成長到 5 成左右,所以也蠻符合上圖的趨勢。

好,無論如何,Social Web 真的來了,問題是,你該注意什麼?

社群化 (Social Layer)

記住,Social Web 代表的不是技術的革命,而是消費者文化的革命。這是一場網路從「代號」走向「實名」、從「網友」走向「朋友」的運動。所以任何已經存在的服務,如果能加上「真實身分」和「社交圈」這層「Social Layer」來大大提升價值的,你就有可能打敗原本的巨人。

社群媒體最佳化 (SMO)

當使用者不再花更多時間搜尋網站,而仰賴朋友們的推薦時,你必須要學會如何贏得這些推薦,而這就是社群媒體最佳化 (SMO/Social Media Optimization) 的含意。去年九月,我就觀察到從社群媒體來到我的網誌的人,已經超越 Google SEO。事實上,又經歷了 9 個月的發展,從 Facebook 來的人已經是 Google 的 2 倍多。所以這件事情已經一去不回頭,你必須要學會如何讓消費者在社群媒體上推薦你,而又如何讓這些推薦能夠他們的朋友注意到。

社群媒體是媒體,不是社群

很多人經營粉絲頁,把它當作以前 Web 1.0 時代的「會員」,或是 Web 2.0 時代的「社群」在經營 — 粉絲人數、留言、按讚越多越好,數大就是美。事實上,社群媒體根本不是「社群」,如果你再看仔細一點,它其實是「媒體」。既然是媒體,那傳播力、影響力、轉換率才是重點。也就是說,粉絲像「主顧客」一樣,貴在精不在多。留言、按讚當然很好,但更重要的是這些人會不會幫你分享、推薦東西給他們的朋友,那才能達到一傳十、十傳百的病毒效果,如果這是成立的,那才是真正的社群媒體。

所以,無論是 Facebook 來了、Social Web 來了,還是 Web 3.0 來了,那只是名號的問題,重點是這個革命真的正在發生,而身為創業者,你該做的就是好好深入了解,並且運用成為自己的優勢。加油!

Filed under , having 0 意見  

經營媒體,不是經營社群

by :::陽光馬戲團:::

感謝 Peter Gu 提供本篇文章的題目,如果你錯過之前的「你想看什麼?」,現在還可以去提問、投票,讓你想看的主題更快被我寫成文章。
最近出席了幾次關於「社群媒體」(Social Media) 的研討會、座談會,一則以喜,一則以憂。高興的是大家似乎開始感覺到這個世界正在急速改變,難過的是與會的所謂「專家學者」,根本搞不懂「社群」、「媒體」和「社群媒體」之間的差異。
Media (媒體)
首先,我覺得大家從根本就誤會了「媒體」。媒體是介質、是通路、是資訊傳播的管道,就像是「街道」一樣。所以,媒體是中立的、是沒有色彩的。可惜大家在討論媒體時,往往把它和「新聞媒體」、「廣告媒體」、「印刷媒體」混為一談,接著把「新聞」、「廣告」、「印刷」這些東西的「性格」通通都加諸在「媒體」上面,最後當然是極度混淆、雞同鴨講。因此,要討論「社群媒體」之前,請大家先記住一件事情,「媒體」是一個簡單到不行的東西,它就是資訊流通的管道,如此而已。
Social
Social 是什麼?Social 就是人和人之間的關係,可能是家人、是朋友、是同學、是同事。或者說 Social 就是人與人之間的連結,這些連結有強弱、有發生的頻率、有加速、有半衰期、有新增、有廢除。它是一個極度動態的世界,一個不斷更新的圖譜 — 所有才有 Social Graph (社群圖譜) 這個字。
Social + Media
所以當 Social 碰上了 Media,會發生什麼事情呢?當然就是人與人之間的連結,成為了資訊傳播的管道。這不是廢話,人跟人之間本來就會講話。對,所以這不是重點。而是近幾年來網路的發展,讓這個行為出現了什麼轉變。
實名制 + 真實人際
首先,是 Facebook 的興起,讓人們開始大規模的在網路上使用真實身份,和真實生活中的朋友互動。剛說的,Social 之間有強弱之分,這就是「朋友」和「網友」之間最大的差別。「網友」跟你說這台相機很好,你可能要再多看幾篇評測才會買單。「朋友」跟你說這台相機好用,你頂多再多問兩個問題就可以決定,而這,就是「社群媒體」最厲害的時候。
經營媒體,不是經營社群
所以經營社群媒體,不是在經營社群。經營社群講的是「黏性」,要的是網友常常回來,多多逗留。但是經營社群媒體,追求的是不是回來,而是出去;不是黏性,而是傳播。所以社群媒體,是讓粉絲會主動向他們的「朋友」,推薦你的商品和服務。因為你講一百次,講破了嘴,都沒有他們講一次有用。這,就是社群媒體和社群最大的不同,也是可口可樂行銷長口中「擁抱表達」的真正意涵。
所以,大傢伙們可以不懂這件事情,他們可以繼續傻傻的把社群媒體外包給別人經營,但是身為創業團隊,你,一定要搞清楚這件事情,因為這就是你打敗他們最好的開始。
再說一次,社群媒體,是媒體,不是社群。Now go hack it and hack it hard!

Filed under , having 0 意見  

ARO觀察:年齡族群網站使用狀況

2011年7月7日 星期四 by :::陽光馬戲團:::

文章類別: ARO觀察, rand

台北,2011年7月8日 – 創市際市場研究顧問公司於今日公佈台灣地區年齡族群網站使用狀況。

不同的年齡族群有不同的生活模式,使用網路的行為也有差異。觀察台灣地區年齡族群上網使用狀況,過去一年19歲以下族群使用網路的時間最高,其次是20-29歲族群,40歲以上族群使用時間最短。此外,19歲以下與20-29歲族群使用時間也高過全體網友的平均值。

在瀏覽網頁數量方面,19歲以下與20-29歲族群平均瀏覽的網頁數高過全體網友平均值,而40歲以上的族群則是所有年齡族群裡瀏覽網頁數最少的族群。顯示年輕族群花費較多的時間瀏覽較多的網頁;而年長者則呈現相反趨勢。

另外觀察各年齡族群,造訪網站類別的傾向程度分析發現,19歲以下與20-29歲族群對社群、線上影音、新聞等類別傾向程度較高;20-29歲與30-39歲族群對購物中心傾向程度較高;30-39歲與40歲以上族群對政府行政類別傾向程度高;。其中各族群對入口網站、社群與搜尋引擎的傾向程度較無太大差異。

社群為不同年齡族群傾向程度皆高的網站類別,觀察2011年5月各年齡族群使用社群網站的狀況發現,19歲以下造訪社群網站的使用者佔據該年齡族群高達99.27%,顯示19歲以下族群幾乎每位網友皆會造訪社群網佔,而20-29歲族群裡則有96.69%的網友曾造訪社群網站。各年齡族群相比較,20-29歲族群是使用人數最高的族群,佔據整體社群網站使用者近3成。此外,20-29歲族群也是社群網站網頁瀏覽數與使用時間貢獻比例最高的族群。

整體而言,各年齡族群使用網路狀況不同,年齡較輕的族群不僅上網時間較長,也瀏覽較多的網頁數,年齡較長的族群則是相反。而各族群喜好的網站類別有差異,19歲以下與20-29歲族群偏好社群、線上影音;20-29歲與30-39歲族群對購物中心傾向程度較高;30-39歲與40歲以上族群則是喜好政府行政類別。此外社群網站使用者以20-29歲比例最高,也是使用時間與瀏覽網頁數最高的族群。

Filed under having 0 意見  

研究案例:數位相機小調查

by :::陽光馬戲團:::

近年來因為具有高畫質的智慧型手機的出現,部分數位相機的市場漸漸被取代,因此廠商也不斷推出更輕巧、拍攝品質更佳的數位相機,同時也朝向多功能的方向發展,例如:觸碰螢幕拍照、自拍鏡等,成為廠商們刺激消費者購買的方式。為了進一步了解台灣人對於數位相機的消費行為及喜好,創市際市場研究顧問在2011年06月,針對全體網友進行了一項數位相機的調查研究,調查期間為06月03日至06月04日,總共回收了3,587份有效樣本,且在95%的信心水準下,抽樣誤差±1.64%,再依照行政院主計處2011年5月台灣地區人口之性別及年齡人口結構進行加權。
根據調查結果顯示,超過八成的受訪者擁有「一般型數位相機」;而有近兩成一的受訪者擁有「單眼數位相機」,只有10.6%的受訪者表示「我與我家人都沒有數位相機」。

針對自己或家人有數位相機的受訪者進行調查,詢問受訪者挑選數位相機品牌的因素,有近三成受訪者會挑選「品牌形象佳」的數位相機品牌;其次為「價格便宜」(23%),再來則是「畫素高」(21.7%),第四則為「操作介面易使用」(21.6%),第五則為「品牌愛用者」(20.5%)。

進一步調查受訪者獲得相機相關資訊的管道為何,近三成的受訪者表示得到相機相關資訊的管道為「親友的經驗分享」;其次為「數位相機品牌官方網站」(27.9%);第三項則是「入口網站下的3C頻道」(24.5%),如:Yahoo!奇摩3C家電、MSN 3C家電;第四則為「網路論壇∕討論區」(22.4%),如:Mobile01、DCView數位視野;第五則是為「店頭陳列」(19.7%)。

綜合以上調查結果發現,有近九成的受訪者擁有數位相機,其中有近三成的受訪者會選擇「品牌形象佳」的數位相機,而約略有兩成三的受訪者會選擇價格較便宜的數位相機;而在獲得數位相機資訊的管道中以「親友的經驗分享」的受訪者居占較多數,約占三成。從調查中可以發現,19歲以下、職業為學生之受訪者較會因為數位相機「外型設計佳」而選購;女性較會以「親友的經驗分享」當作獲得數位相機資訊的管道,而年齡在25-39歲的受訪者較會選擇「網路論壇∕討論區」作為資訊來源管道。

Filed under having 0 意見  

HOW TO: Measure the ROI of a Content Marketing Strategy

2011年7月6日 星期三 by :::陽光馬戲團:::


Shane Snow July 4, 2011 by Shane Snow 42

1,147
inShare

Share on Tumblr

email

share

inShare1,147

Share on Tumblr

email

share

Shane Snow is co-founder of Contently.com, an “agile publishing” platform for brands-turned-publishers and freelance journalists.

Most people quit blogging — and most companies do too, for that matter.

Like healthy diet, frequent exercise, proper posture or any other New Year’s resolution, blogging results take time. A 2008 Technorati survey put the abandonment rate of blogs at about 95%.

Part of the reason for low blog success rate is that most of us have a hard time predicting what kind of return blogging will achieve. “If I blog every day for a month, will I get more leads?” Probably. But it may take six months, not one.

That doesn’t mean it’s not worth the fight.

Before the Internet put publishing and distribution tools in everyone’s hands for free, companies that wanted brand exposure paid for time and/or placement on a third party media property (radio ads, TV commercials, banners). Many still do, but a general shift is occurring online – away from outbound marketing and paid media, toward creating one’s own branded content and spreading that media across the social web.

According to the Custom Content Council, 68% of CMOs say they are shifting budget from traditional advertising to this type of content marketing.

But measuring the return on investment (ROI) on content is difficult, especially if you’re not judging success by ad revenue.

Nine out of ten organizations market with content, according to a recent B2B content marketing survey. Companies like Mint, American Express and Hubspot are now competing with “traditional” media companies for eyeballs with their own content. They’re seeing results -– not necessarily in the form of advertising, but rather, through leads, subscribers and brand awareness.

A recent study by Hubspot indicates that Hubspot customers who practice inbound marketing (of which content is a core element) increase leads an average of 4.2 times within a few months. Other studies have shown similar results, that consistent content output increases conversions.

Content costs money, and measuring the results of your content effort is important. But an effective content strategy is like planting a garden: it takes consistent work that eventually pays off in large quantities. However, failure to water or plow that garden will result in weeds, in other words, a blog post every three months whose only comments are spam.

So how do you convince your boss, your partners or even yourself that content is a good investment? Here are three steps to effectively measure your content strategy:


1. Understand What You’re Measuring


Traditionally media companies use readership and ad revenue as the yardstick for content’s success. In content marketing, however, the goal is typically to achieve some sort of conversion or to build “brand awareness,” a rather ambiguous metric.

A conversion can consist of a mailing list or an RSS subscriber, a user signup, a phone call, a sale or any number of user interactions. The first step to measuring ROI on your content strategy is to set a goal.

If your content goal is to increase user signups, you first need to know your baseline: how many signups are you getting now, and from what sources? Once you start your content efforts, you want to be able to measure the results against that baseline.


2. Use Proxies to Measure Initial Success


Unless you’re already starting with a large audience (huge mailing list, captive user base, etc), it’s going to take a while to build momentum, and even longer to start seeing conversions. However, several proxies can help you chart your progress.

These proxies present immediate signs of encouragement, more so than, say, search engine ranking, which can take a while to manifest. Here’s a quick list of proxies for measuring a blog’s ROI:

  • Facebook likes
  • Retweets
  • LinkedIn and other shares
  • Reblogs
  • Links back
  • Comments
  • Time spent on page
  • Average page views per visitor (especially if you’re effective at internal linking of your posts)
  • Followers
  • @mentions

These proxies will monitor how well your content is resonating, how you’re building trust in your brand. That trust will eventually turn into loyalty, advocacy and continued conversion.

It’s important to note that absolute measurements are rarely useful. What you’re looking for is a trend line. The number of retweets relative to previous content on your site or peer sites is a more useful yardstick than the total number of retweets.

Though it may not seem like much, an average of five tweets on a post today versus an average of one tweet three weeks ago is a great sign of progress.

Also, because some pieces of content will be outliers (whether spikes or duds), it’s important to pay attention to aggregate trend data rather than isolated post data. For example, the average number of retweets in June compared to April is a better measure of progress than the number of retweets on today’s blog post versus yesterday’s.


3. Measure Both Primary and Secondary Conversion Indicators


From a practical standpoint, measuring conversions can be as simple as installing Google Analytics, or keeping a spreadsheet of leads or even tick marks on a whiteboard.

While keeping track of the raw conversion numbers (How many leads are we getting this month versus five months ago when we weren’t blogging?) is important, it’s also crucial to measure secondary indicators. If you’re measuring leads, these might include the following:

  • Quality of leads
  • Retention period
  • Lifetime value per lead
  • Length of sales cycle
  • Number of new customers referred by lead

“One way we try to quantify ROI is to track content users very closely,” says Sam Slaughter, a producer at Comcast.net. “That way we can tell if they went from consuming content to buying a product, or to bookmarking the page, or to digging deeper into the publisher site or any number of actions that the publisher might be able to monetize. From there, we can often come up with an actual dollar value from that piece of content.”


Patience Is the Secret


Content strategy for most businesses isn’t about instant advertising metrics anymore; therefore, clear ROI data can take a while to manifest. Once it does, however, returns will generally increase as you continue to consistently publish.

“When we talk about ROI for content we often use terms like ‘adoption,’ ‘time on site,’ ‘page views per unique’ and things like that,” says Slaughter. “The idea [is] that while you might not be monetizing the content on your site directly, you are using that content to attract new and better users who you can monetize down the road.”

In the end, planning, tracking and consistency will help you succeed. As Problogger founder Darren Rowse recently tweeted, “Building blogs is like building muscles.” Great content properties, like muscles, take patience.

Filed under having 0 意見  

Dell最新行銷「More You」,從「你」開始

by :::陽光馬戲團:::

這是文章內文區塊

撰文者:許凱玲編譯發表日期:2011-07-06

推文至Facebook 推文至騰訊微博 推文至新浪微博 推文至Plurk 推文至twitter

戴爾最新推出「More You」行銷計畫,戴爾從旗下八大品牌中挑出三個主打品牌:專為一般使用者設計的Inspiron、講求效能的XPS、以及遊戲玩家的Alienware,希望賦予「Dell」多一點的生活感。

由於在設計和性能方面,戴爾並不像蘋果擁有獨特鮮明的個性。因此,這一次的行銷計畫特別強調用戶使用戴爾做了哪些事情,行銷長Paul-Henry Ferrand表示,戴爾重視連結消費者的情感,重新找到定位,一年前或許你不知道戴爾在消費者電腦市場代表什麼,現在我們的服務讓消費者數位生活無縫連結。

消費者部門副總Tim Peters表示,這次活動針對Y世代、有孩子的家庭、商業人士、以及遊戲玩家,戴爾不想包山包海,迎合所有消費者。鎖定特有族群的策略,也讓戴爾在消費者電腦市場連續兩季都獲利。

在「More You」宣傳計畫之下,拍攝一系列廣告,都是以用戶名字為標題,秀出這些用戶如何使用電腦、桌機、平板電腦,Derek、Sarah、Julien、武……等素人在廣告中分享了戴爾如何和他們一起生活。

Filed under having 0 意見